
The Oracle Database Advisors - Part 2
Part 1 | Part 2
In the first article in this series, we introduced you to the Advanced Workload Repository (AWR), which is a key foundation component for Oracle Database 10g’s new database advisor architecture. We discussed what AWR is, how to manage it, and how to take advantage of the data contained in it. Oracle Database 10g moves beyond simple statistics collection, and introduces the process of analysis and reporting of the collected statistics through a new tool called The Automated Database Diagnostic Monitor (ADDM). In this article, we will introduce you to the ADDM, and in following articles we will introduce you to the minions of ADDM, the advisors.
Introducing ADDM
So, you have these databases and you want to not only manage them, but you want to manage them effectively. You want to know if they perform efficiently. Until now, the primary native Oracle approach to database analysis was a manual process involving the collection and analysis of statspack reports. Manual database problem analysis is not a very scalable solution, and success is less than repeatable. What we need is an automated way to perform this analysis so that we can analyze many enterprise databases with results that are consistent. Enter Oracle Database 10g and ADDM.
As we mentioned in part 1 of this article, AWR snapshots take place every hour by default (and can be managed to occur more or less frequently, can be taken manually, or not at all). Once the AWR snapshot is taken, the ADDM analysis occurs automatically as long as the STATISTICS_LEVEL parameter is set to TYPICAL or ALL. The new Oracle Database 10g background process MMON performs the ADDM analysis. The results of the ADDM run is stored in the AWR, and can be accessed through various means such as OEM, manual query, or an Oracle supplied API.
One of the parameters that ADDM uses to perform its analysis is DBIO_EXPECTED. This parameter is not set in the database parameter file, but is rather set using the Oracle supplied package DBMS_ADVISOR. This parameter defines the response time expected by Oracle from the disk I/O system, and the value defaults to 10 milliseconds. If you have slower disks, you will want to reset this value. In the following example, we have reset the expected disk response time to 20 milliseconds, since that is our measured response time from our disks:
Exec dbms_advisor.set_default_task_parameter(’ADDM’, -
’DBIO_EXPECTED’, 20000);
ADDM Analysis Goals
ADDM’s goal is to improve the value of a statistic called db time.
Db time is a value that Oracle calculates to indicate the cumulative
time that is spent processing user requests. ADDM’s goal is to reduce
the overall db time value, and it does not target individual users or
user response times, and thus the db time it uses is an aggregate value
of overall system CPU and wait times You can see the current value of
db time for the entire system by querying the V$SYS_TIME_MODEL or you
can see it for a given session by using the V$SESS_TIME_MODEL view as
seen here:
select sum(value) "DB time" from v$sess_time_model
where stat_name='DB time';

    DB time
----------
    109797
In an effort to reduce DB Time, ADDM analyses a number of different database-related problems, including:
- Memory-related issues such as shared pool latch contention, log buffer issues, or database buffer cache related problems
- CPU bottlenecks
- Disk I/O performance issues
- Database configuration problems
- Space-related issues, such as tablespaces running out of space
- Application and SQL tuning issues such as excessive parsing and excessive locking
ADDM Analysis Results
The results of the ADDM analysis are stored in the AWR in the form of findings. There are three different kinds of findings:
- Problem — A problem indicates a root cause problem that is causing a database performance problem.
- Symptom — A symptom indicates a performance issue that normally points to one or more specific problem findings.
- Information — This is just basic database-related information that is not related to a specific problem.
ADDM also ranks the findings based on the proportion of DB time that the finding appears to be consuming. Oracle provides recommendations associated with the findings that can be used to reduce the overall DB time value, and improve the overall performance of the Oracle database. Each finding can have multiple recommendations, with different alternatives for solving the problem.
Each recommendation consists of two elements, the action and the rationale. The action is the suggested remedy that Oracle wants you to implement to correct the problem identified in the finding. The rationale explains the reasons that Oracle is suggesting the action, and can include additional information on how to implement the action.
Locating the Findings
There are a number of ways to view the findings of ADDM. In the next sections, we will first discover how to manually query for the ADDM findings. Then, we will look at the benefits of using OEM to look at the ADDM findings (like less tedious typing of SQL statements!). Finally, we will look at how to run the addmrpt.sql script, which can be used to perform an ADDM analysis on a range of snapshots in the AWR.
Using the Oracle data dictionary to view ADDM findings
The principle data dictionary views you will use to retrieve the ADDM findings are:
- DBA_ADVISOR_TASKS — Contains specific information on each task. The execution of an ADDM analysis is a single task (other tasks include execution of the various advisors which we will introduce in later articles).
- DBA_ADVISOR_RECOMMENDATIONS — This view provides the recommendations associated with a specific ADDM task execution.
- DBA_ADVISOR_FINDINGS — This view provides the findings associated with a specific ADDM task execution.
- DBA_ADVISOR_RATIONALE — This view provides the rationales associated with the specific ADDM recommendations.
If you want to see the specific findings and recommendations of the last ADDM run, you can execute this query:
Set pages 1000
Set lines 75
Select a.execution_end, b.type, b.impact, d.rank, d.type,
'Message           : '||b.message MESSAGE,
'Command To correct: '||c.command COMMAND,
'Action Message    : '||c.message ACTION_MESSAGE
From dba_advisor_tasks a, dba_advisor_findings b,
Dba_advisor_actions c, dba_advisor_recommendations d
Where a.owner=b.owner and a.task_id=b.task_id
And b.task_id=d.task_id and b.finding_id=d.finding_id
And a.task_id=c.task_id and d.rec_id=c.rec_Id
And a.task_name like 'ADDM%' and a.status='COMPLETED'
Order by b.impact, d.rank;
Here is some sample output from this query:
EXECUTION TYPE            IMPACT       RANK                       TYPE
--------- ----------- ---------- ---------- --------------------------
MESSAGE
----------------------------------------------------------------------
COMMAND
----------------------------------------------------------------------
ACTION_MESSAGE
----------------------------------------------------------------------
14-DEC-04 PROBLEM       41889449          2         Host Configuration
Message           : Waits on event "log file sync" while performing CO
MMIT and ROLLBACK operations were consuming significant database time.
Command To correct: UNDEFINED
Action Message    : Investigate the possibility of improving the
performance of I/O to the online redo log files.
14-DEC-04 PROBLEM       53727085          1                 SQL Tuning
Message           : SQL statements consuming significant database time
 were found.
Command To correct: RUN SQL TUNING ADVISOR
Action Message    : Run SQL Tuning Advisor on the SQL statement with
SQL_ID "8hk7xvhua40va".
14-DEC-04 PROBLEM      177916166          0             DBConfiguration
Message           : The buffer cache was undersized causing significant additional read I/O.
Command To correct: ALTER PARAMETER
Action Message    : Increase SGA target size by increasing the value of parameter "sga_target" by 68 M.
14-DEC-04 PROBLEM     6.4314E+10          1        Application Analysis
Message           : Read and write contention on database blocks was
consuming significant database time.
Command To correct: UNDEFINED
Action Message    : Trace the cause of object contention due to SELECT
 statements in the application using the information provided.
In this output, we see the date of the analysis, the finding type (in these cases, all we found were problems), a message indicating what was causing the problem, the command needed to correct the problem, and additional information in the form of an action message. We find that the biggest problem appears to be log file sync waits, followed by a problem SQL statement (note the SQL_ADDRESS for that statement is provided, allowing you to easily cross-reference that address to the SQL area).
One thing I should note is that ADDM is in its freshman incarnation. As a result, some of the analysis and feedback is pretty elementary, and suggested actions are not always that helpful. Still, ADDM is worth taking a look at, and for the beginning DBA, it can be helpful for some of the common beginner DBA problems that you might run into. In contrast to the elementary state of ADDM, some of the advisors (like the SQL tuning advisors and the materialized view advisors) are quite helpful. We will be covering these advisors in future articles, so stay tuned.
Using OEM to view the ADDM findings
Enough typing already! You may have read an earlier article that I wrote here for DBAzine.com in which I confessed that I’ve decided I like OEM in Oracle Database 10g. One of the new features built into OEM in Oracle10g is its ability to report on the ADDM analysis of your database. It’s much easier than writing the SQL, I assure you. Through OEM, you can look at the most current ADDM run results, or you can execute an analysis for a different range of snapshots and review the results. Let’s look at each of these different options in more detail.
Using OEM to view the current ADDM findings
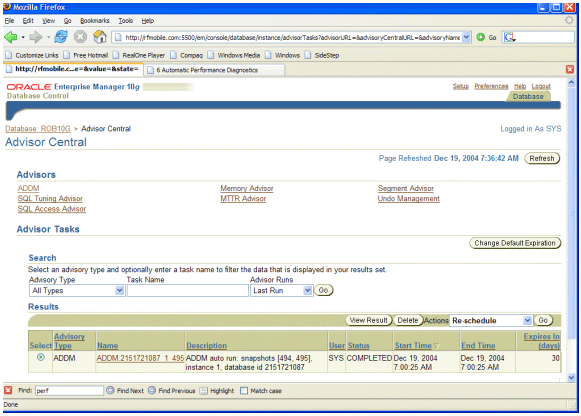
To locate the findings of the most current ADDM, run Go to the
bottom of the OEM home page and click on the Advisor Central link. This
link will take you to the Advisor Central page. On the Advisor Central
page, you will find the Results section toward the bottom. If ADDM is
working correctly, you will see a row in the Results section in which
the advisory-type column says ADDM. This should be the most recent ADDM
run and this fact should be verified by the time and date that appears
in the Start Time and End Time columns. Here is an example of what this
page should look like:
You can click on the link in the name column to see the results of
the last ADDM run. This brings up the ADDM screen, which looks like the
two screen prints you see next:
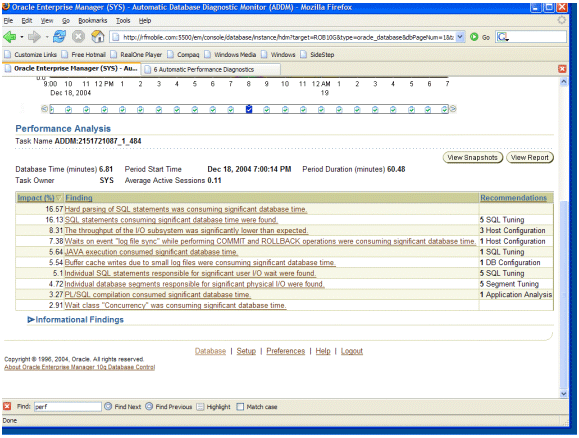
This screen also gives you the opportunity to see the complete ADDM report if you wish. Simply press the View Report button, and the report will be displayed.
You can also look at the results of older ADDM runs from this screen. On the upper part of the ADDM screen, under the Database Activity section, you will notice a chart labeled Database Activity. Under that chart, just above the Performance Analysis section header, there is a pick list that allows you to pick the ADDM run in which you are interested. Here is a screen shot of this section:
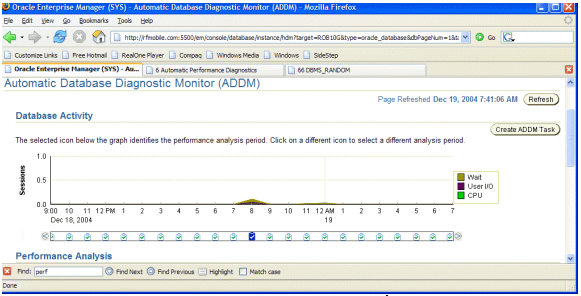
In this screen shot, we see activity starting on December 18th, and running into December 19th, and we have a little activity peak between 7:00 p.m. and 9:00 p.m. on the 18th.
Generating a custom ADDM report in OEM
OEM supports generation of custom ADDM reports for a specific start and stop snapshot range. To generate a custom ADDM report from the OEM ADDM page, click on the Create ADDM Task button. This will take you to the Create ADDM Task page as seen in this screen shot:
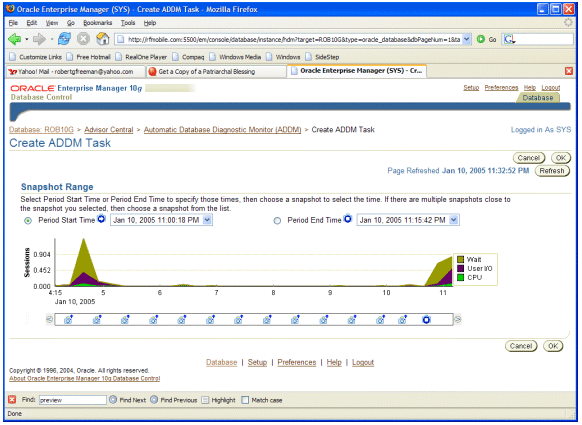
Select the period start time and period end time values to correspond with the snapshot times that you wish to report on. Once you have selected the time periods, click on OK to generate the ADDM report for that time period. The resulting report looks the same as the report we previously showed you.
Using the addmrpt.sql Script to Analyze a Snapshot Range
The addmrpt.sql report is much like the statspack reports available in earlier versions of Oracle. You run the addmrpt.sql script from SQL plus (the script is located in the $OH/rdbms/admin directory). The script provides you with a list of snapshots from which you can generate the report. You select a begin snapshot, and end snapshot, and finally, you define the name of the report that you want addmrpt.sql to create. Addmrpt.sql will then run the ADDM analysis on the snapshot pairs, and output the analysis to the report.
The resulting report contains a header and then detailed finding information. The header will look much like this example:
   DETAILED ADDM REPORT FOR TASK 'TASK_3455' WITH ID 3455
          ------------------------------------------------------
           Analysis Period: 10-JAN-2005 from 22:00:54 to 23:00:19
     Database ID/Instance: 2151721087/1
  Database/Instance Names: ROB10G/rob10g
                Host Name: RFMOBILE
         Database Version: 10.1.0.3.0
            Database Time: 609 seconds
           Snapshot Range: from 1570 to 1574
    Average Database Load: 1.2 active sessions
This contains summary information related to the ADDM analysis. Following the header, individual findings will be listed. An example of such a finding is seen here:
FINDING 1: 51% impact (309 seconds)
-----------------------------------
SQL statements consuming significant database time were found.
      ACTION: Run SQL Tuning Advisor on the SQL statement with SQL_ID
         "db78fxqxwxt7r".
         RELEVANT OBJECT: SQL statement with SQL_ID db78fxqxwxt7r and
         PLAN_HASH 3879501264
         SELECT a.emp, b.dname
         FROM EMP a, DEPT b
         WHERE a.deptno=b.deptno;
Note a few interesting things in this report. First of all, our first finding indicates that the problem identified had a 51 percent overall impact in the DB time. In other words, the ADDM report is sorting its findings based on those processes that are consuming the most database time. We see, looking at this finding further, that it is a SQL statement that is causing problems, and ADDM suggests that we tune the statement. Oracle gives us the SQL address and hash value so we can find the SQL statement in the SQL area.
Note that the ACTION suggests that we run the SQL Tuning Advisor to generate some suggested tuning actions on the SQL statement in question. In another article, we will look at the SQL Tuning Advisor and see just how it can help us to tune SQL statements in Oracle Database 10g.
Conclusion
ADDM is a good start. As with any new utility, it has room for improvement and growth in future releases of Oracle. There are other aspects related to ADDM that we have not been able to address in this article such as being able user defined alerts. In another article, we will look at the first advisor, the SQL Tuning Advisor.
Robert Freeman is an Oracle consultant and has been working with Oracle for more than 15 years. In the last five years, Robert has produced nine books, and a number of articles on Oracle including Oracle Database 10g New Features and Portable DBA: Oracle. Robert has also spoken at various user conferences including IOUG-A and UKOUG.
Contributors : Robert G. Freeman
Last modified 2006-01-05 11:17 AM