Collecting and Storing Performance Monitor Counter Data into a SQL Server Table
When you are monitoring the performance of your SQL Server machines, what tools do you use? I’m guessing most DBAs use the Windows Performance console to graphically display performance counters for their SQL Server machines. But how do you determine the performance trends over time on your SQL Server machines? Where do you store all the performance data that you gathered when monitoring SQL Server machines? Do you save it in SQL Server database tables? This article will show you how to use the Performance console to set up a counter log to gather performance data for SQL Server 2000. I will discuss how to load the performance data into a SQL Server database table. And I will also cover how to use some Windows XP modules to automatically start your performance counter logs on a Windows 2000 server.
Starting the Performance Console
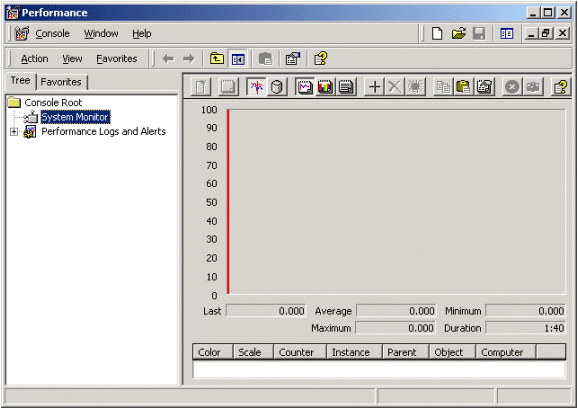
There are a number of different ways to start the Performance Console. The easiest way is to run the perfmon executable. To do this, click on the Start button, then the Run… button, and finally type perfmon into the Open: textbox and click on the OK button. Another way start the console is to go into Control Panel, click on the Administrative Tools icon, then click on the Performance icon. Regardless of how you start the console, when it starts up, the following console window is displayed:
What are Performance Counters
A performance counter is a counter that contains a specific performance measurement for a windows machine, like Pages/sec, or Logins/sec, and so on. Each performance counter is part of a performance object that typically contains many counters. The Pages/sec counter is part of the Memory performance object, whereas the Logins/sec can be found in the SQL Server:General Statistics performance object.
What is a counter log?
A Counter Log is a definition of which performance counters to log, how often to log the counter values, where to write the counter log, and how long the counter log should run. A counter log can be manually started, started and stopped automatically, and rolled-over, based on pre-defined criteria. You can define multiple counter logs, in which each counter log could be used for a specific purpose, such as monitoring memory usage, or monitoring SQL Serve usage.
Defining a counter log
To define a counter log, expand the Performance Logs and Alerts item (as shown in the preceding screen shot) by clicking on the plus sign. Three additional items from which you can select will appear: Counter Logs,Trace Logs, and Alerts. To define a counter log, right click on the Counter Logs item and select New Log Settings … from the pop-up menu. You will then be prompted to enter the name of your new Counter Log. After entering your counter log name, click on the OK button and the following screen will be displayed:
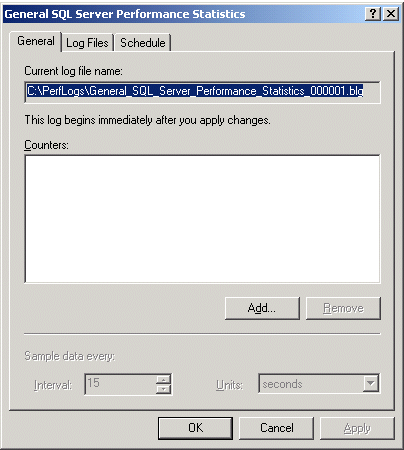
This screen shot is for a new counter log I’m defining that has the name, “General SQL Server Performance Statistics.” The next step in defining a counter log will be to define the counters you want to gather. Since the counter log I am defining will be for gathering general statistics for my SQL Server machine, I’m going to select a number of different counters that related to the performance of SQL Server and associate those counters with my counter log. The first counter I am going to select is the Pages/Sec Memory object counter. To bring up the screen on which I can select counters, I click on the Add Counters … button. This displays the following:
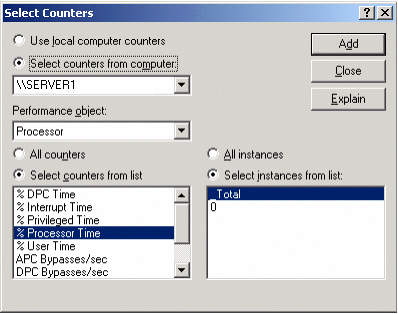
To get to the Memory performance object, I need to click on the down arrow next to the Performance object Processor. When I do this, all the different Performance objects of which my machine is aware are displayed. By scrolling through the list of Performance Objects, I find the Memory object and then find my Pages/sec counter, as the following screen shows:
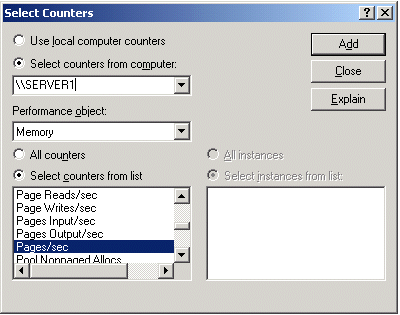
Once I have highlighted my counter, I click on the Add button. I repeat this process for each counter I want to add to my counter log. Once I have added all the counters to my counter log, I can click on the Close button. When doing this my counter log definition looks like this:
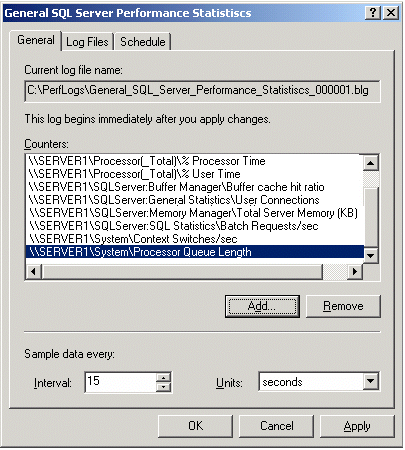
As shown in the previous image, I selected a number of different counters from different Performance Objects. Here is a complete list of all the counters I selected above for my “General SQL Sever Performance Statistics” counter log:
\\SERVER1\Memory\Available Bytes
\\SERVER1\Process(sqlservr)\Page Faults/sec
\\SERVER1\Process(sqlservr)\Working Set
\\SERVER1\Processor(_Total)\%Priviledged Time
\\SERVER1\Processor(_Total)\%Processor Time
\\SERVER1\Processor(_Total)\%User Time
\\SERVER1\SQLServer:Buffer Manager\Buffer cache hit ratio
\\SERVER1\SQLServer:General Statistics\User Connections
\\SERVER1\SQLServer:Memeory Manager\Total Server Memory (KB)
\\SERVER1\SQLServer:SQL Statistics\Batch Request/sec
\\SERVER1\System\Context Switches/sec
\\SERVER1\System\Processor Queue Length
Note that each counter consists of a three-part naming convention, in which part one is the server name, part two is the Performance Object, and the last part is the counter.
Once I have selected all the counters I want to log, there are still few more things I need to do to complete my counter log definition. First, I need to consider how often I would like to sample my performance counters. (The sampling interval used for the previous example is 15 seconds.) For this example, I used the default interval, which is fifteen seconds, but this may not be appropriate for all counter logs. Keep in mind that the more often you sample, the more machine resources you consume, and the more data you collect.
The last few things you must consider when setting up a counter log are where to save the data associated with your counter log, the file type of the log, the name of the log, and lastly, the schedule you want to associate with your Counter Log. To define the log file type and name, click on the Log Files tab. The following screen will be displayed:
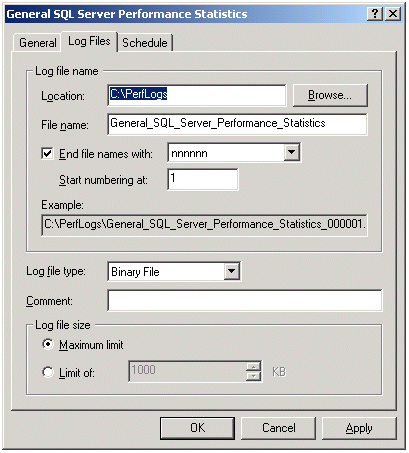
I want to set up my counter log to write to a file that has a date time stamp as part of its name and that has the data stored in a comma-delimited format. I want the data to be stored in comma delimited format so it can be easily inserted into a SQL Server table using a DTS package. To meet these specifications, I first set the Location: to a directory where I want the counter log information to be saved. Next, I specify a File name: for my log file. After that, I set the End file names with: to mmddhhmm, thus allowing my generated log file to contain a date time stamp down to the minute as part of the file name. To set the Log file type:, I use the pull-down arrow so I can select Text file – CSV option. This allows the performance monitor to create a comma-delimited text file. Lastly, I set the log file size to the Maximum Limit, so my log will continually grow while writing the performance data to my log file.
Finally, I need to associate a schedule with my counter log. Once again, since I am building a counter log that will be loaded into SQL Server, I want to routinely close my log and start a new one every day. I also want to start the process of loading my SQL Server table with the most recently closed log. To do this, I use the Schedule tab to specify these scheduling criteria, as shown in the following screen shot:
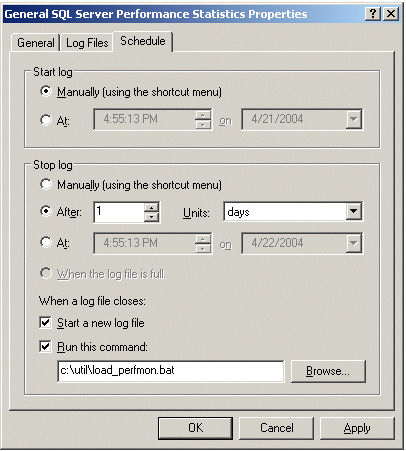
Here, I have specified that my logging be stopped after one day. Also, I have indicated that when the log closes, I want to start a new log file, as well as run the command c:\util\load_perfmon.bat. The load_perfmon.bat script runs a process to load the log file that was just closed into my SQL Server table in which I store all my long-term performance data.
Loading Performance Data into a SQL Server Table
Loading the performance data into a SQL Server table is extremely easy, since I specified that my log file should be a comma-delimited text file. If you open a log file that is created with the same specifications as I set for my new counter log, you will see that the first record in the file contains the names of each counter, and the rest of the records will contain a single row of data for each interval logged. Each of these interval rows will contain a value for each counter that was logged, separated by a comma. When the script c:\util\load_perfmon.bat is run, it executes a DTS package. The DTS package will load performance counter data into an existing SQL Server table using a simple transform data task. By using this process each time a new log is started, I can maintain a SQL Server table that contains all the performance counter data for each interval log over a long period of time. Once the performance data is loaded into my table, I’m able to manipulate it however I like to produce my database usage trend reports.
Automatically Starting Your Counter Log on Reboot on a Windows 2000 Machine
With Windows 2000, there is no tool available to automatically start counter logs from the command line. But that does not mean you are out of luck in automatically starting your Counter Log, because there is a way to use some Windows XP modules to start your performance logs. To set up your Windows 2000 machine to automatically start your performance counters, you first need to copy the modules “logman.exe” and “pdh.dll” to a directory on your 2000 machine. Once that is done, you can use the “logman start” command to start your counter log. Using this method, the following commands are all that it takes to start the counter log I created previously:
cd c:\logman_dir\
logman start “General SQL Server Performance Statistics”
where “logman_dir” is the directory into which I placed the “logman.exe” and “pdh.dll” Windows XP modules on my Windows 2000 machine.
To start the counter log automatically when your machine boots up, you will need to create a process that will run the previous commands at start-up. There are a number of ways to do this. The method I am using is to create a registry entry to run a batch script in the HKEY_LOCAL_MACHINE\SOFTWARE\Microsoft\Windows\CurrentVersion\Run registry hive. If you use this method make sure you fully understand how to update the registry, or you run the risk of corrupting the registry. If you corrupt your machine’s registry, you might make your system unusable, requiring that you to rebuild your machine.
Performance Monitoring Best Practices
It is always important to consider the performance impacts of monitoring your system. To reduce the impacts, you should consider the following performance monitoring best practices:
- Minimize the number of counters you are monitoring.
- Run your counter logs from a different machine then the one you are monitoring.
- Do not write your counter logs to the same disk you are monitoring.
- Set the counters you are monitoring and the monitoring interval appropriately for your situation. In essence, don’t monitor more counters or more often than necessary.
- If you are worried about the overhead of monitoring, log to disk, instead of using the System Monitor Graph, since writing the log file to disk requires fewer resources.
Conclusion
Gathering long-term performance data can greatly help with capacity planning. The long term performance data will help you identify performance trends and set baseline performance measurements, thus allowing you to make good business decisions based on actual performance data. This article has given you the basics for setting up a counter log to automatically gather SQL Server performance data on an on-going basis. If you would like to have information regarding the current and past performance of your SQL Server machines, then you should consider implementing some long-term performance monitoring method using performance counter log data.
--
Gregory A. Larsen is a DBA at Washington State Department of Health. He has been working with computers since the late 1970s, and has a BS in Computer Science, with a minor area of study in Mathematics. During Greg’s DBA career, he has managed databases on Windows, Unix, and IBM mainframes; before becoming a DBA, he developed and maintained applications. Greg has written a number of articles for different web publishing sites, as well as SQL Server Magazine. Greg also maintains a Website that contains a number of SQL Server examples to common DBA and SQL developer issues.
Last modified 2005-04-12 06:21 AM
