
Server-side Tracing
Are you reluctant to monitor activity on your SQL Server machines on an ongoing basis because you have heard that running Profiler causes a lot of overhead? Have you wanted to gather SQL Server usage statistics over time, so you can do some kind of trend reporting, or change back method, based on the resources that customers actually use? Given any of these scenarios, you should consider running server-side traces. This article will define server-side tracing, explore why it is more efficient than Profiler, and explore how to use it to gather SQL Server 2000 usage information into a physical file.
What is Server-side Tracing?
Server-side tracing is the process of having your SQL Server machine save events to a physical file on that machine without using the Profiler client tool. An event can be any one of more than 100 different types of events, including SQL:BatchCompleted, Login, SQL:StmtCompleted, Object:Created, and so on. Server-side tracing is enabled and controlled by using SQL Server system-supplied stored procedures and functions. With these system-supplied processes, you can identify what to trace, when to start and stop tracing, what traces are running, and view trace information stored in the trace file.
Why Using Server-side Tracing is More Efficient than Using Profiler
When performing server-side tracing, SQL Server does not need to send information back to a client tool. Sending information to a client tool causes extra overhead and increases network traffic. Instead of sending information to a client tool, SQL Server stores the trace information in a physical file on the server. This file is written sequentially much like SQL Server writes to the transaction log.
System-stored Procedures and Functions to Control Server-side Tracing
In SQL Server 2000, Microsoft provides seven different system-stored procedures and/or functions to control server-side tracing. The following is a matrix that lists each stored procedure (SP) or function and includes a brief description of what each one does:
| Named of SP/Function | Description |
sp_trace_create |
This SP defines a new trace |
sp_trace_generateevent |
This SP is used to create a user-defined event |
sp_trace_setevent |
Used to add or remove events being traced from a existing trace |
sp_trace_setstatus |
Changes the status of an existing trace |
sp_trace_setfilter |
Used to apply filters to an existing trace |
fn_trace_geteventinfo |
Returns information about the events and columns being traced by a give traceid |
fn_trace_getinfo |
Returns information about a specific trace or all traces |
fn_trace_getfilterinfo |
Returns filter information associated with a specific trace |
These stored procedures and functions are all you need to can create and monitor server-side traces without using Profiler. I will discuss most of these as I show you how to create and use a server-side trace to monitor your SQL Server machine. However, for more information about these SPs and functions, read the server-side trace information in Microsoft SQL Server Books Online.
Creating a Server-side Trace
To create a server-side trace, you need to define a trace, add the events you want to collect to the trace, and then start the trace. After doing these tasks, your server-side trace will be running and gathering information about the events you requested to a trace file. With the following simple example that trace all “SQL:BatchCompleted” events occurring on my SQL server machine, I will demonstrate how this works.
First, I need to collect SQL Server events to create a trace event. I will use the following code to create my trace event. As you review this snippet of code, keep in mind that all the code to create my server-side trace is normally run from a single script. Therefore, most successive snippets depend on prior snippets of code. To see all the code together or to run the code to create and start my example on your server, click here.
declare @rc int
declare @traceid int
declare @maxfilesize bigint
set @maxfilesize = 50

exec @rc=sp_trace_create @traceid=@traceid output,
@options=0,
                         @tracefile=N'C:\temp\trace_file',
                         @maxfilesize=@maxfilesize,
                         @stoptime=NULL

if @rc > 0 print 'sp_trace_code failed with error code ' +
rtrim(cast(@rcm as char))
else print 'traceid for the trace is ' + rtrim(cast(@traceid as char))
In the previous example, I have used the “sp_trace_create” to create a SP trace that has no options (@options=0), will write to the physical trace file “c:\temp\trace_file” (@tracefile), has a maximum trace file size of 50 megabytes (@maxfilesize) , and has no date or time of when the trace will stop (NULL specified for @stoptime). Just because you run this code doesn’t mean the trace begins running. Instead, this command lets SQL Server know that you are starting the first steps to define a trace definition. After the previous commands are run, the trace is created, but it has not been started.
Before starting the trace, I defined to SQL Server; I must now identify what I want SQL Server to trace once the trace begins. The sp_trace_setevent SP is used to tell SQL Server which events will be traced. This SP only identifies a single event and column to trace. To trace multiple columns and/or multiple events, you must execute this SP for each event and column you want to trace. The following is an example that follows on from the code previously noted that identifies a number of different columns to be captured for a single event (“SQL:BatchCompleted”). This event happens to have the ID, 12 (@eventid = 12).
declare @on bit
set @on = 1
-- Trace TextData for SQL:BatchCompleted events
exec sp_trace_setevent @TraceID,@eventid=12,@columnid=1,@on=@on
-- Trace DatabaseID for SQL:BatchCompleted events
exec sp_trace_setevent @TraceID,@eventid=12,@columnid=3,@on=@on
-- Trace ApplicationName for SQL:BatchCompleted events
exec sp_trace_setevent @TraceID,@eventid=12,@columnid=10,@on=@on
-- Trace LoginName for SQL:BatchCompleted events
exec sp_trace_setevent @TraceID,@eventid=12,@columnid=11,@on=@on
-- Trace StartTime for SQL:BatchCompleted events
exec sp_trace_setevent @TraceID,@eventid=12,@columnid=14,@on=@on
-- Trace Reads for SQL:BatchCompleted events
exec sp_trace_setevent @TraceID,@eventid=12,@columnid=16,@on=@on
-- Trace Writes for SQL:BatchCompleted events
exec sp_trace_setevent @TraceID,@eventid=12,@columnid=17,@on=@on
-- Trace CPU for SQL:BatchCompleted events
exec sp_trace_setevent @TraceID,@eventid=12,@columnid=18,@on=@on
I want to use this trace to gather the resources used for each completed SQL batch, so I’m collecting the TextData, DatabaseId, ApplicationName, LoginName, StartTime, Reads, Writes, and CPU information. I use this trace information to identify the resources consumed by each database or login for a given time period. Also, this code allows me to see the T-SQL commands executed in each batch. You can review SQL Server Books Online for additional events that can be traced, and the columns you can capture.
Now that I have created my trace and defined the event and columns I want to trace, I am ready to start my trace. To start it, I must change the status of the trace from “stopped” to “started” by issuing the following T-SQL command:
exec sp_trace_setstatus @TraceID, 1
Now that the trace is running, let’s run a few commands against SQL Server to see whether they are captured to my trace file, “C:\temp\trace_file.” For this test, I issue the following commands from a Query Analyzer window:
Select top 1 * from Northwind.dbo.Orders
go
Select top 2 * from pubs.dbo.Authors
go
Select count(*) from Northwind.dbo.[Order details]
Go
Stopping and Closing A Running Server-side Trace
Before I can review the information in the physical file to see whether the commands Ive issued made it to my trace file, I must first stop the trace, then close and delete it from the server. To do this, I issue the following commands:
exec sp_trace_setstatus <traceid>, 0
exec sp_trace_setstatus <traceid>, 2
Note that <traceid> is the traceid created when I ran the sp_trace_create SP. If you are running the sample code shown previously, the traceid would have been printed in a message that began, “traceid for the trace is…”
Reviewing the Server-side Trace Information
There are two methods you can use to review the information in the trace file: You can either user Profiler, or you can view the information with a SELECT statement.
To use Profiler, I use the “File” – “Open” – “Trace File” option and then select the trace file I created. When performing a server-side trace for which a “trc” extension was added to the file name, I used in the code previously noted, since SQL Server added this “trc” extention. When I use Profiler to view the trace file, a basic Profiler display shows the columns I selected; the following is what it looks like on my machine.
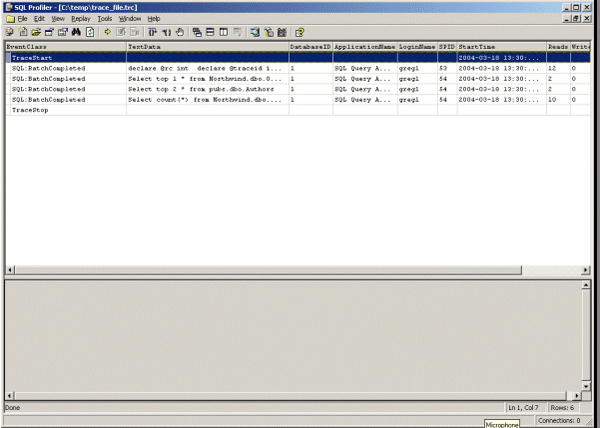
In all, four commands were captured by my trace. The first is the command that started the trace, and the three remaining commands are the SELECT statements I ran in my example. Notice that only the columns I want to trace are displayed by Profiler.
To return the trace information in Query Analyzer, you can use a SELECT statement that calls the function, “fn_trace_gettable.” This function returns the trace information in table format. The following is the what that SELECT statement would look like for the trace file I just created:
select * from ::fn_trace_gettable('C:\temp\trace_file.trc', default)
When I execute this command in Query Analyzer the following rows are returned in the results pane.
Once again, you can see there is a one row for the batch of code that defined the trace definition, and then the three SELECT batches I ran above are displayed. Although note that NULL is displayed for any column that was not traced.
Loading the Trace File into SQL Server
Occasionally, you may not only want to review the trace file, but to place the trace information in a SQL Server table so you can do some further analysis using T-SQL. You can do this by using a SELECT INTO statement, or INSERT statement, if the target table of the INSERT is already defined. An example follows of how to use the SELECT INTO statement to insert the rows from the trace I just created into a table called “Trace_Table”:
select * into Trace_Table from ::fn_trace_gettable
('C:\temp\trace_file.trc', default)
Determining the Status of All Traces Running on Server
The “fn_trace_getinfo” function can be used to determine the status of all traces defined on your server. The following command uses the fn_trace_getinfo function to return all the property settings for each trace that is defined to the server.
SELECT * FROM :: fn_trace_getinfo(default)
You can also use this function to return the properties for a single trace.
How to Generate Server-side Trace Code using Profiler
Does creating the server-side trace code from scratch seem a little overwhelming? If so you can easily get started with server-side tracing by using Profiler to produce the code necessary to start your trace. First, you should bring up Profiler and define the trace you want to perform. Once you have specified the trace to be done, you must start it. While the trace is running, go to the file menu item and click on the “Script Trace …” option. This option will allow you to create a trace that will run in SQL Server 2000 or SQL Server 7. Click on the version of SQL Server on which you want the trace to run; Profiler then prompts you where you want to save the generated trace code. Once you have saved the code, you can run it in Query Analyzer to create your server-side trace.
Conclusion
Unfortunately, I can’t cover everything about server-side tracing in one short article, but I hope I have given you enough information to get you started in developing our own server-side traces. I also hope this article has stimulated you to think about how you might use server-side tracing to get information about what kinds of events are running on your SQL Server machines. If you want to minimize the impact of using the Client Profiler tool to gather trace information, then you should consider implementing the more efficient method of using server-side traces.
--
Gregory A. Larsen is a DBA at Washington State Department of Health. He has been working with computers since the late 1970s, and has a BS in Computer Science, with a minor area of study in Mathematics. During Greg’s DBA career, he has managed databases on Windows, Unix, and IBM mainframes; before becoming a DBA, he developed and maintained applications. Greg has written a number of articles for different web publishing sites, as well as SQL Server Magazine. Greg also maintains a Website that contains a number of SQL Server examples to common DBA and SQL developer issues.
Contributors : Gregory A. Larsen
Last modified 2005-04-12 06:21 AM