Oracle Histograms Tips and Techniques
Histograms are a cost-based optimizer (CBO) feature that allows for Oracle to see the possible number of values of a particular column. This is known as data skewing and histograms can track the number of occurrences of a particular data value when deciding on what type of index to use or even whether to use an index at all. Histograms give the CBO the ability to see the uniqueness of a particular data value.
This article will show how to create histograms and illustrate their usefulness in the CBO decision-making process. This article will also discuss two methods of setting up histograms (height-based and value-based) and when to use each method.
A histogram is nothing more than a series of buckets (default is 75 buckets) where the number of values occurring within a range is tracked in these buckets. These buckets are established by the statistics-collection methods. Using DBMS_STATS, the following syntax will establish 20 buckets for the ENAME column in the EMP table:
EXECUTE DBMS_STATS.GATHER_TABLE_STATS
('scott','emp', METHOD_OPT => 'FOR COLUMNS SIZE 20 ename');
Information about existing histograms can be viewed in [DBA USER ALL]_TAB_HISTOGRAMS and [DBA USER ALL]_TAB_COL_STATISTICS. If histograms are created on partitioned objects, then additional information can be gleaned from DBA_PART_HISTOGRAMS and DBA_SUBPART_HISTOGRAMS.
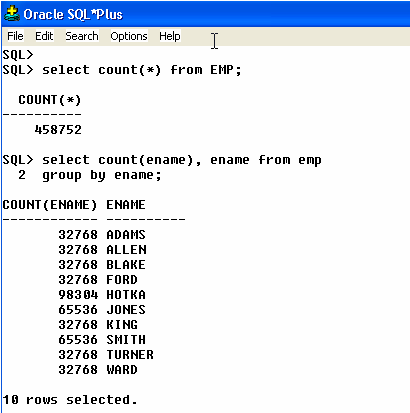
I have created two objects: EMP and EMP_NO_HISTOGRAMS for our example here. I created a bunch of extra rows (458,000 in both) and changed 25 percent of them to "HOTKA."
The SQL statement “select count(ename), ename from emp group by ename;” is useful to show possible data skewing within the key values of our test EMP tables. Notice in Example 1 that there are more JONES and SMITHS than the other names and that there are more HOTKA names than any other name.

Example 1: Possible data skewing.
I have created an index on the ENAME column on both objects. I ran statistics on both objects, creating a histogram on the ENAME column in the EMP table; see Example 2 for the syntax I used to generate a 20-bucket histogram on the EMP table.

Example 2: 20-bucket histogram on EMP table.
There are two kinds of histograms: height-based and value-based. A height-based histogram is when there are more values than buckets and the histogram statistics shows a range of rows across the buckets. A value-based histogram is when there is a bucket for each value. Which one do you use? This SQL might help: “select distinct(count(ename)) from emp;”. If there are hundreds of values (using this SQL), then set the SIZE parameter large enough so that Oracle can see the skewing (the SQL in Example 1 might help here). If there are less than 100 values (for example), then set the SIZE parameter to the number of values expected. Oracle will populate these buckets based on the data. What size is appropriate? This is difficult to determine by a rule-of-thumb. Experiment with different sizes until you either see the histogram being used on skewed data or you get better results. You can use the ‘SIZE AUTO’ option that will let Oracle decide how many buckets to assign. There is no option to tell Oracle to do one kind of histogram over the other.
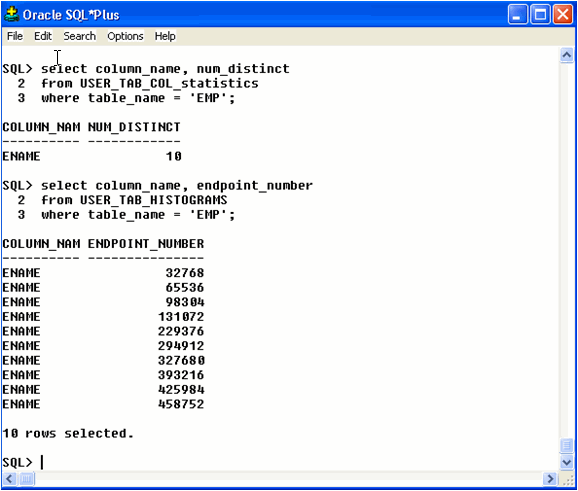
Let’s see how our histogram came out on the EMP table. Notice in Example 3 that USER_TAB_COL_STATISTICS shows us that we have ten distinct values in the ENAME column. Notice that we have ten buckets for column ENAME in the USER_TAB_HISTOGRAMS. Oracle stores the ENDPOINT_VALUE in hex so it is difficult to see the data when creating histograms on character data. Oracle created a “value-based” histogram. We can see that Oracle did store useful information. For example, notice the difference between row four and row five below, row five represents the “HOTKA” bucket.

Example 3: Visualizing the histogram buckets.
Let’s see how we did. I will use my freeware JSTuner tool for illustration purposes.
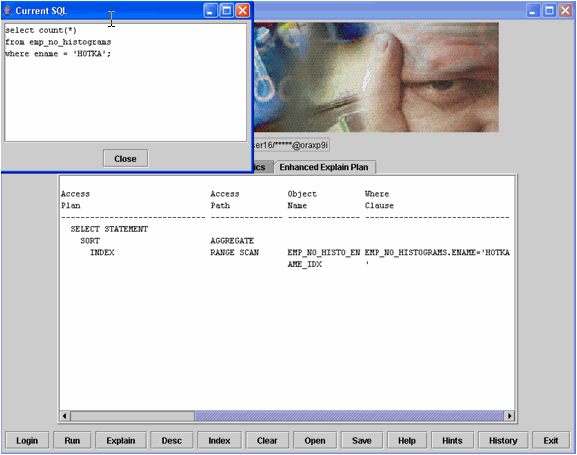
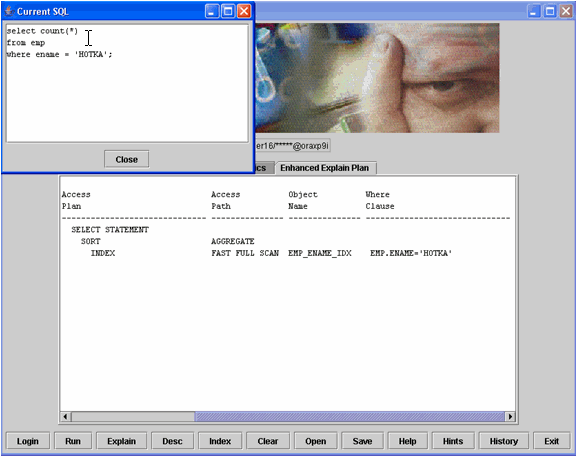
Example 4 shows a sample SQL statement selecting on the “HOTKA” value and the explain plan shows the index being accessed via a Range Scan. This is probably the best choice since the EMP_NO_HISTOGRAMS does not have a histogram so the CBO cannot see the data skewing. Notice in Example 5 that using the same SQL but against the object EMP with a histogram on the ENAME column, we got a different explain plan. The CBO can now see that “HOTKA” is most prevalent in the database, and chose to scan the index at the leaf level using multi-block read-ahead (Fast Full Scan) instead of the Range Scan in example 4.

Example 4: Sample SQL using the index via range scan.

Example 5: Sample SQL using the index via fast full scan.
Is one explain plan better than the other? It is hard to say and it is equally hard to say how this will play out in your applications. This simple test simply shows that the CBO will take into account the availability of a histogram and arrive at a different explain plan that will attempt to make a better selection based on the information the CBO has about the data.
Summary
The CBO makes decisions based on statistics. Histograms provide the CBO with a more granular look at the data in identified columns. Generally speaking, the better the statistics about a particular object and data within the object, the better decisions the CBO can then make.
This article illustrates how to create, monitor, and utilize histograms. I hope you find this information useful.
--
Dan Hotka is a Training Specialist who has over 27 years in the computer industry and over 22 years of experience with Oracle products. He is an internationally recognized Oracle expert with Oracle experience dating back to the Oracle V4.0 days. Dan's latest book is the Oracle10g on Linux by Oracle Press. He is also the author of Oracle9i Development By Example and Oracle8i from Scratch by Que and has co-authored 6 other popular books. He is frequently published in Oracle trade journals, and regularly speaks at Oracle conferences and user groups around the world. Visit his website at www.DanHotka.com. Dan can be reached at dhotka@earthlink.net.
Contributors : Dan Hotka
Last modified 2005-09-16 10:55 AM
