Keep Oracle Up And Running (Fast)
Paper presented by Dave Ensor at the European Oracle User Group, Copenhagen, June 1999.
Summary
To keep Oracle up, scheduled down time needs to be carefully planned, and unscheduled down time must be avoided. The paper discusses the reasons for scheduled down time and how to eliminate, or at least reduce, the requirement for such downtime by better planning and more careful use of Oracle features.
The most common causes of unscheduled downtime are discussed, along with the many cases where the Oracle instance is apparently running as required but at least some users are unable to take full advantage of the application service. An important distinction is also drawn between real and arbitrary causes of such problems, and the paper goes on to identify good practice that will reduce the incidence of both classes of event.
The final section of the paper reviews how to maintain application and instance performance, concentrating on the identification of the key issues and the steps that can be taken to address them. The reader is reminded that, in the final analysis, Oracle uses CPU, memory and I/O resources as a result of user requests (SQL Statements and PL/SQL anonymous blocks) and that performance management will always be at its most effective when practiced at the application level. A simple but highly effective technique is described for finding the SQL statements that will benefit from tuning.
Availability
In order for an Oracle database to be available to its users at least one Oracle instance must be running with the database mounted with the resources required by the application available for access. There are a number of operations that can only be performed while user service is suspended, and the need to execute these operations leads to "scheduled outages."
Scheduled Outages
Traditionally the most common scheduled outages were for stand-alone backup of the database, often referred to as cold backups. Although some sites still prefer to perform cold backups, they are never strictly necessary. Oracle fully supports hot backups, by which they mean backups taken while database updating is in progress. Hot backups require significantly more care and attention both to safely take and to restore, but if outage is to be minimized the additional effort is justified.
The other common reasons for scheduled outages are to restart the Oracle instance in order to change some parameter that can only be set at instance startup, and to perform some type of data reorganization. Although instance shutdown and subsequent startup with different parameters need only take a few seconds for a dedicated instance, the length of service interruption seen by the users will generally be much longer and many sites only permit one such episode per week.
With effective design and care in setting Oracle storage parameters, data reorganizations should be rare. However with current technology, when they are necessary they invariably require denial of service to the user population and speed of operation becomes paramount. Sadly many sites report that the most common cause of an unscheduled outage is a scheduled outage that has overrun, often as a result of an unexpected error. It is essential that schema maintenance operations are carefully tested and rehearsed to ensure that they run correctly, and complete within the allotted time.
Oracle8i gives the ability to reorganize (rebuild) an index without a scheduled outage, but as yet this facility is not available for a standard table.
Unscheduled Outages
It is easy to fall into the trap of believing that if the instance is up, and all the required tablespaces are online, then the Oracle-based part of the application service will be available. Sadly there are any number of reasons why just having the instance available does not mean that every user will receive all of the service that they want. Some may be unable to connect to the instance, and receive no service at all, and others may only be able to complete some of their intended operations. These denials of service are generally the result of capacity constraints.
Real vs Arbitrary Constraints
As an example of the distinction between an arbitrary capacity constraint and a real one, consider the the following Oracle error:
ORA-01631: max # extents (20) reached in table PROD.ORDERS
At some point the table PROD.ORDERS has had the attribute MAXEXTENTS set to 20 and the table now wishes to grow beyond this size. If there are still some free extents left in the tablespace that contains the table, then the limit is essentially arbitrary. Somebody, presumably a DBA, decided that the table should not grow beyond 20 extents and new data has arrived which will take the table over that length. The normal solution to this problem is to increase MAXEXTENTS for the table, perhaps to 25 in this case. However the same insert that caused the error above might under different circumstances cause the following error instead of the one suggested above: ORA-01653:
unable to extend table PROD.ORDERS by 13 in tablespace ORDERDATA
Now the problem is less arbitrary. The tablespace is full, or at least has no free extent large enough to satisfy the request to extend this particular table by 100 Kb (the database block size used in this example was 8192 bytes). There may well be enough disk space left in the file system to allow the tablespace to be extended, the required space may exist on other tablespaces, or it may even exist in this tablespace but not as a contiguous extent of the required size. Each of these cases would make the failure somewhat arbitrary in the sense that had the system been set up differently the error would not have been seen, or at least would not have been seen until later. The normal "quick fix" to this problem is to either reduce the size of the next extent to be allocated so that the requested space is available, or to add another file to the tablespace. Automatic tablespace extension is supported by Oracle but raises a number of issues, including the notion that if the space for auto-extension is known to be available then it might have been easier to simply allocate it in the first place!
Predicting & Avoiding Failure
Unscheduled Outages can be anticipated, and in many cases prevented, by monitoring the history of usage of database space and the resources within the Oracle instance. Any trend that is likely to lead to a denial of service should be detected and addressed before it causes a problem. Although there are a great many areas within Oracle that are capable of causing such problems, the most common are within space management as in the examples above and in the size of the fixed length lists held within Oracle's PGA and SGA structures. These lists are sized using Oracle initialization parameters: among the ones likely to cause errors are the parameters sessions and open_cursors.
The usage of the slots in the memory structures allocated by these parameters should be carefully monitored along with any other parameter to which the application has been found to be sensitive.
The rate of growth of each tablespace must also be tracked, and individual objects should be monitored to ensure that they are still comfortably contained within the space provided for them.
Performance
Much has been said and written about Oracle performance tuning. The successful tuner needs to master a repertoire of different tuning techniques and to have the knowledge and ability to determine which is the right one to apply the right one in each circumstance.
On the other side of the coin, however, is the simple notion that every Oracle performance problem is caused by asking an instance to do something that takes too long. Only usage can cause problems. It can be argued that taking hot backups can be the cause of certain types of performance problems, but we can probably argue that copying a set of database files to tape is a form of usage!
Initial Diagnosis
If we can agree that it is usage that causes problems then we can concentrate our initial diagnosis in two areas, the statements that make up the usage and the wait states that the usage encounters. We should also check out a few basic statistics at the platform level to find out whether the server is running out of any of CPU, I/O bandwidth or memory. In the case of both CPU and I/O bandwidth it is crucial to look at the numbers device by device. It is not unusual to find that a 4-processor machine has a 25% CPU load, but that it is also CPU bound on one CPU and the other are effectively idle. This implies that an application is single-threading through some piece of code that is also CPU hungry. Normally this in turn indicates either a severe locking problem or that the machine is running a single user task. In this last case the only solution is to make the programs more efficient or to find some way of performing the same work in a multi-task configuration. This may be non-trivial to do!
Work Forwards Rather Than Backwards
Where the performance issue to be addressed is strictly local to a specific component of the entire application, it is almost certain that the solution will lie in the component itself, or in an indexing problem with one of the tables accessed by that component. Knowing this, the easiest way to progress the problem is usually to find out what the component does, and in particular what use it makes of the server. Running that part of the application with sql_trace enabled and processing the resulting trace file through the utility tkprof should quickly identify whether there are SQL statements taking an inordinate amount of time to run, or being executed more frequently than is necessary.
The first attack on the problem should be to resolve these issues and to retest. Often the performance improvement will be enough to completely solve the problem.
Wait States
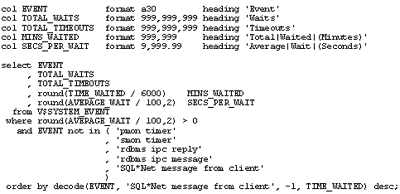
We can tell what is holding up processing inside an Oracle server by looking in the virtual view V$SYSTEM_EVENT. A sample query is shown below:

The timer and ipc events filtered out in the query are internal Oracle issues that need not normally trouble tuners. The event 'SQL*NET message from client' is the one on which you want to see waiting occurring. It means that the database server was sitting waiting for some work from the client application rather than the other way round. This is good news.
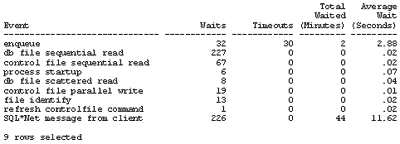
Running this query against my Version 8.0.4 instance shortly after startup (and with timed statistics enabled) we get the following output:

Looking at the top of this simple report we can see that the "application" has been suffering from lock conflicts. We can also see from the last line that we spent a good amount of time waiting for the user rather than the other way round, though to make this really useful we would need to know the total wait time as a percentage of the total user connect time. So in this (artificial) case we need to look for a lock conflict to resolve.
As a side issue, it is always possible that your performance problems are being caused by some internal conflict within the Oracle server, perhaps some new variation on the latching problems that caused so much difficulty in the early releases of both Oracle6 and, to a lesser extent, Oracle7. If you do have such problems then V$SYSTEM_EVENT is going to contain the evidence. You may have to use V$LATCH to get more detail, and you may need to reduce the threshold for the average wait time in order to see them reported in the sample query used above. V$SYSTEM_EVENT is usually just a start point: it can tell you what kinds of waits to go investigate.
Problem Statements
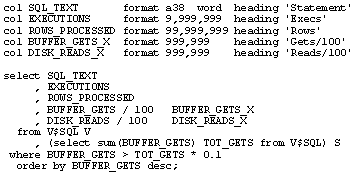
Most performance problems are not caused by lock conflicts, or by latching problems, but come simply from executing SQL statements or PL/SQL anonymous blocks. Although the correlation is not perfect, we can get a good measure of the most expensive statements by a simple query against V$SQL. The sample script below looks for statements that account for more than 10% of the total number of buffer gets incurred by all the statements in the buffer pool.

Executing this script on the same instance as before gave the following output:

In this highly artificial case the most resource consumptive statement was one of Oracle's recursive SQL statements, but a consistent heuristic from previously untuned batch and OLTP applications is that there are normally between 3 and 5 SQL statements which account for more than 75% of the load.
Just tuning these statements is often enough to meet the performance requirement, not that this is necessarily easy. But it is effective, and you know that you are working on something that will have an effect.
Magic Ratios
Many Oracle tuners appear fixated by a series of magic ratios, in particular the buffer cache hit ratio and the library cache pin ratio. There is a widespread belief that "improving" these ratios will automatically improve performance. At the mathematical level this may be true, but all too frequently the changes in performance that result are insignificant in relation to the improvement required.
On the other hand it is well worth keeping an eye on these ratios, and if the critical resource on the server turns out to be implicated in the ratio then it may be worthwhile to see what can be done to adjust the ratio. Put another way, if disk reads are taking too much time or causing queues, then improving the buffer cache hit ratio will reduce disk reads and may also reduce disk writes, and this will help. But improving the queries that are causing all the reads would almost certainly help more unless full table scans are absolutely necessary.
If CPU load is the main constraint, then improving the library cache pin hit ratio will achieve a reduction in CPU load but this is will only be significant if the SQL is efficient. The longer the SQL statements take to run, the less important the time spent parsing them; in my experience very few sites with severe Oracle performance problems have efficient SQL.
The main point under this heading, though, is that these ratios are no place at which to start on this work. You start by looking for excessive time spent in wait states and resource consumptive SQL statements.
Conclusion
Keeping Oracle running is mainly about planning, but also requires administrators to check for growth of both database usage in terms of users and transactions and also space utilization.
Ensuring that it runs fast enough typically means refining the applications rather than the instance. Once you've got the performance within the agreed targets, it is important to stop tuning and to put in place monitoring to ensure that the performance levels are maintained. Increasingly we are seeing automated response time testing being run from widely distributed stations firing standard transactions across a network at application and data servers, and recording the observed response times. This technique is used extensively within BMC Software to verify acceptable performance from our key internal applications.
---
Dave Ensor is a Product Developer with BMC Software where his mission is to produce software solutions that automate Oracle performance tuning. He has been tuning Oracle for 13 years, and in total he has more than 30 years' active programming and design experience.
As an Oracle design and tuning specialist Dave built a global reputation both for finding cost-effective solutions to Oracle performance problems and for his ability to explain performance issues to technical audiences. He is co-author of the O'Reilly & Associates books Oracle Design and Oracle8 Design Tips.
Contributors : Dave Ensor
Last modified 2005-02-18 10:40 AM
