
Using the Dynamic SGA Features of Oracle9i
While the Oracle9i database introduced a huge amount of significant internal enhancements, one of the most exciting for the Oracle DBA is the ability to dynamically reset all of Oracle's SGA control parameters. Unlike Oracle8i, in which the initialization parameters were kept inside a flat file to be read at database startup time, Oracle9i opens up a whole new world of possibilities because all of the Oracle parameters can be reset dynamically using ALTER DATABASE and ALTER SYSTEM commands.
Prior to Oracle9i, the Oracle administrator would have to shut down to reconfigure the INIT.ORA parameters and restarted database instance whenever significant processing patterns changed within the Oracle database. This type of reconfiguration is commonly done in Oracle databases that operated in OLTP mode during the online day, and then switched to a data warehouse mode for evening processing.
This requirement to stop and restart the Oracle database to change the parameters is a significant enhancement to Oracle9i, and one that makes continuous availability an easy goal.
This ability to dynamically grow and shrink different areas within the Oracle SGA offers some exciting new possibilities for the Oracle database administrator. Database activity within each region of the SGA can be monitored individually, and resources can be allocated and deleted according the usage patterns within the Oracle database.
Let's begin by taking a look at the differences between the Oracle9i database and the Oracle8i database. One of the most significant enhancements to Oracle9i is the elimination of the need to have a separate PGA area for all dedicated connections to the Oracle database. As we may remember from Oracle8i, dedicated Oracle connections were required to allocate a separate area within the RAM memory called a Program Global Area, or PGA. This PGA region contains the SORT_AREA_SIZE and additional RAM control structures that were used to maintain the state for the connected task. In Oracle 9i, the PGA region has been replaced by a new RAM region inside the Oracle SGA as specified by the PGA_AGGREGATE_TARGET parameter (refer to figure 1).
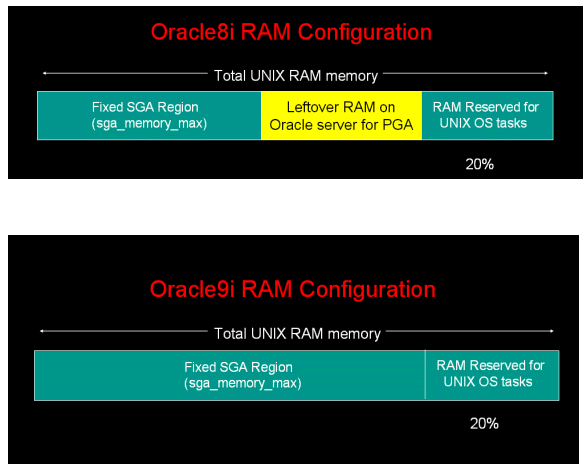
Figure 1: RAM allocation differences between Oracle8i and Oracle9i
Because all RAM memory usage is now handled completely within the Oracle SGA, the Oracle database administrator can fully allocate the Oracle server's RAM memory, up to 80 percent of the total RAM on the Oracle server. Oracle recommends that 20 percent of the RAM memory on a database server be reserved for operating system tasks.
As users connect to the Oracle9i database, RAM for their sort work areas are allocated within the PGA_AGGREGATE_TARGET region of Oracle9i. This allows Oracle9i perform far faster than Oracle8i because the memory is only allocated in used for the duration of the session upon which is immediately freed up to become available for use by other connected Oracle tasks.
Dynamically Changing the SGA Regions
Given that the Oracle administrator now has the ability to grow and shrink all of the areas of the SGA, it might be beneficial to take a quick look at what these SGA areas look like and describe how the Oracle DBA can monitor their usage to most effectively reallocate the RAM memory for the Oracle database. The areas of the SGA are broken into the following categories.
Data buffers -- Oracle9i has up to seven separate and distinct data buffers to hold incoming data blocks from the disks. These include the traditional KEEP pool, the RECYCLE pool, the DEFAULT pool, as well as separate data buffer pools for each blocksize supported by the Oracle database (2K, 4K, 8K, 16K, and 32K) (refer to figure 2).
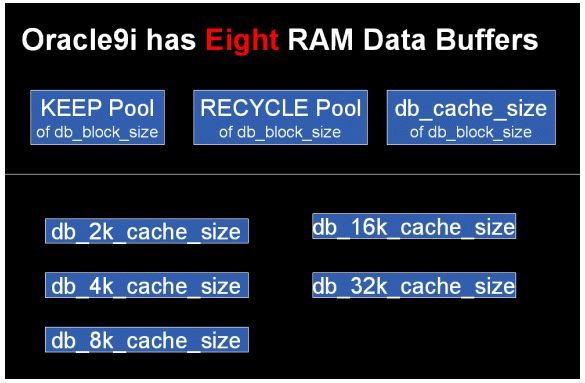
Figure 2: The separate Oracle9i data buffers
We can monitor the data buffer hit ratios for each one of the seven data buffer areas, and if the buffer hit ratio remains consistently about 90 percent, we can steal memory pages from these RAM data buffers and reallocate RAM into other areas of the Oracle instance that require additional memory.
When a Data Buffer Hit Ratio (DBHR) falls, we can de-allocate RAM from one data buffer and reallocate it to another data buffer (refer to figure 3).
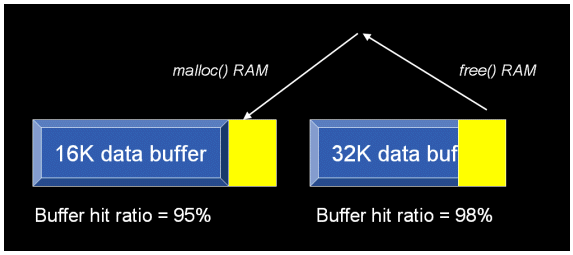
Figure 3: Re-allocating RAM between Oracle9i data buffers
Shared pool -- The Oracle 9i shared pool serves a very important function for the parsing and execution of Oracle SQL statements. High library cache misses often indicate a shortage of RAM within the library cache, and the Oracle 9i database administrator can issue ALTER SYSTEM commands to add additional memory to the shared pool when the shared pool has become overly stressed by parsing and executing SQL statements.
PGA area - The RAM allocated to the PGA_AGGREGATE_TARGET is used by Oracle connections to maintain connection-specific information (e.g., cursor states) and to sort Oracle SQL result sets.
Log buffer -- Evidence of a high amount of activity within the Oracle redo log buffers will also be found in frequent log switches in a high number of redo logs based request. The Oracle administrator can monitor the activity within the redo log area, and dynamically add memory to the law buffer's parameter whenever it appears that the Oracle databases in need of additional RAM memory to service the law buffer areas.
Now let's take a closer look at how these RAM memory areas interact with each other.
Changing PGA RAM Allocation
We may want to dynamically change the PGA_AGGREGATE_TARGET parameter when any one of the following conditions are true:
- Whenever the value of the V$SYSSTAT statistic "estimated PGA memory for one-pass" exceeds PGA_AGGREGATE_TARGET, then we want to increase the value for PGA_AGGREGATE_TARGET.
- Whenever the value of the V$SYSSTAT statistic "workarea executions - multipass" is greater than one percent, the database may benefit from additional RAM.
- You may over-allocate PGA memory, and you may consider reducing the value of PGA_AGGREGATE_TARGET whenever the value of the V$SYSSTAT row "workarea executions - optimal" consistently measures 100 percent.
Let's take a look at how a simple script can be used to identify when the shared pool requires additional RAM.
Measuring Library Cache Misses
set lines 80;
set pages 999;column mydate heading 'Yr. Mo Dy Hr.' format a16
column c1 heading "execs" format 9,999,999
column c2 heading "Cache Misses|While Executing" format 9,999,999
column c3 heading "Library Cache|Miss Ratio" format 999.99999break on mydate skip 2;
select
to_char(snap_time,'yyyy-mm-dd HH24') mydate,
sum(new.pins-old.pins) c1,
sum(new.reloads-old.reloads) c2,
sum(new.reloads-old.reloads)/
sum(new.pins-old.pins) library_cache_miss_ratio
from
stats$librarycache old,
stats$librarycache new,
stats$snapshot sn
where
new.snap_id = sn.snap_id
and
old.snap_id = new.snap_id-1
and
old.namespace = new.namespace
group by
to_char(snap_time,'yyyy-mm-dd HH24')
;Cache Misses
Yr. Mo Dy Hr. execs While Executing LIBRARY_CACHE_MISS_RATIO
---------------- ---------- --------------- ------------------------
2001-12-11 10 10,338 3 .00029
2001-12-12 10 182,477 134 .00073
2001-12-14 10 190,707 202 .00106
2001-12-16 10 2,803 11 .00392
In the above example, we see a clear RAM shortage in the shared pool between 9:00 AM to 10:00 AM each day. In this case we could dynamically re-configure the shared_pool parameter with additional RAM memory from the db_cache_size during this period.
Summary of SGA Thresholds
As we see in table 1, there are several salient thresholds that we can use to monitor the usage of RAM within the SGA. Scripts can be written to poll these values and intelligence can be built into the scripts top reconfigure the SGA when processing demands change.
| RAM Area | Too-small Condition | Too-Large Condition |
| Shared pool | Library cache misses | No misses |
| Data buffer cache | Hit ratio < 90% | Hit ratio > 95% |
| PGA aggregate | high multi-pass executions | 100% optimal executions |
Table 1: Indicators of exceptional conditions within the SGA
Viewing Load on SGA Memory Areas
Oracle9i has introduced several new internal views and new columns in existing views to aid in viewing the internal allocation of RAM memory in Oracle9i. The following new v$ views can be used to monitor RAM memory usage of Oracle9i connections.
- V$PROCESS - Three new columns are added in Oracle 9i for monitoring PGA memory usage. The new columns are called pga_used_mem, pga_alloc_mem and pga_max_mem.
- V$SYSSTAT - There are many new statistics rows, including work area statistics for optimal, one-pass and multi-pass.
- V$PGASTAT - This new view shows internals of PGA memory usage for all background processes and dedicated connections.
- V$SQL_PLAN - This exciting new view contains execution plan information for all currently executing SQL. This is a tremendous tolls for the performance tuning processional who must locate sub-optimal SQL statements.
- V$WORKAREA - This new view provides detailed cumulative statistics on RAM usage for Oracle9i connections.
- V$WORKAREA_ACTIVE - This new view show internal RAM memory usage information for all currently executing SQL statements.
The goal is to use these V$ views to monitor the RAM usage within the SGA and issue ALTER SYSTEM commands to re-allocate RAM memory based upon the processing requirements of the Oracle instance. Let's take a closer look at these new Oracle9i features and scripts that allow us to see detailed RAM memory usage.
While we do not have enough room in this article to explore all of the techniques, let's take a look at a simple example of using the V$SYSSTAT view to determine when to reconfigure the PGA_AGGREGATE_TARGET parameter.
The following query gives the total number and the percentage of times work areas were executed in these three modes since the database instance was started.
work_area.sqlselect
name profile,
cnt,
decode(total, 0, 0, round(cnt*100/total)) percentage
from
(
select
name,
value cnt,
(sum(value) over ()) total
from
v$sysstat
where
name like 'workarea exec%'
);
The output of this query might look like the following:
PROFILE                             CNT        PERCENTAGE
----------------------------------- ---------- ----------
workarea executions - optimal             5395         95
workarea executions - onepass              284          5
workarea executions - multipass              0          0
This output of this query is used to tell the DBA when to dynamically adjust PGA_AGGREGATE_TARGET. In general, the value of PGA_AGGREGATE_TARGET should be increased when multi-pass executions are greater than zero, and reduced whenever the optimal executions is 100 percent.
We can also use the V$PGASTAT view to determine RAM usage for our Oracle instance. The V$PGASTAT view provides instance level summary statistics on the PGA usage and the automatic memory manager. The following script provides excellent overall usage statistics for all Oracle9i connections.
Here is a simple script to detect PGA RAM usage within Oracle9i.
check_pga.sqlcolumn name format a30
column value format 999,999,999select
name,
value
from
v$pgastat
;
The output of this query might look like the following:
NAME                                                   VALUE
------------------------------------------------------ ----------
aggregate PGA auto target                             736,052,224
global memory bound                                        21,200
total expected memory                                     141,144
total PGA inuse                                        22,234,736
total PGA allocated                                    55,327,872
maximum PGA allocated                                  23,970,624
total PGA used for auto workareas                         262,144
maximum PGA used for auto workareas                     7,333,032
total PGA used for manual workareas                             0
maximum PGA used for manual workareas                           0
estimated PGA memory for optimal                          141,395
maximum PGA memory for optimal                        500,123,520
estimated PGA memory for one-pass                         534,144
maximum PGA memory for one-pass                        52,123,520
In the above display from v$pgastat we see the following statistics.
- Aggregate PGA auto target - This column gives the total amount of available memory for Oracle9i connections. As we have already noted, this value is derived from the value on the INIT.ORA parameter PGA_AGGREGATE_TARGET.
- Global memory bound - This statistic measures the max size of a work area, and Oracle recommends that whenever this statistics drops below one megabyte, you should increase the value of the PGA_AGGREGATE_TARGET parameter.
- Total PGA allocated - This statistic display the high-water mark of all PGA memory usage on the database. You should see this value approach the value of PGA_AGGREGATE_TARGET as usage increases.
- Total PGA used for auto workareas - This statistic monitors RAM consumption or all connections that are running in automatic memory mode. Remember, not all internal processes may use the automatic memory feature. For example, Java and PL/SQL will allocate RAM memory, and this will not be counted in this statistic. Hence, we can subtract value to the total PGA allocated to see the amount of memory used by connections and the RAM memory consumed by Java and PL/SQL.
- Estimated PGA memory for optimal/one-pass - This statistic estimates how much memory is required to execute all task connections RAM demands in optimal mode. Remember, when Oracle9i experienced a memory shortage, it invoked the multi-pass operation. This statistics is critical for monitoring RAM consumption in Oracle9i, and most Oracle DBA's will increase PGA_AGGREGATE_TARGET to this value.
Now that we understand the concept, let's take a look at possible methods for automating the SGA reconfiguration.
Putting It All Together
In a UNIX environment it is very easy to schedule a task to change the RAM memory configuration when the processing needs change. For example, many Oracle database operate in OLTP mode during normal work hours, while at night the database services memory-intensive batch reports.
As we have noted, an OLTP database should have a large value for DB_CACHE_SIZE while memory-intensive batch tasks require additional RAM in the PGA_AGGREGATE_TARGET.
The UNIX scripts below can be used to re-configure the SGA between OLTP and DSS without stopping the instance. In this example, we assume that we have an isolated Oracle server with eight gigabytes of RAM. We also assume that we reserve 20 percent of RAM for UNIX overhead, leaving a total of six gigabytes for Oracle and Oracle connections. These scripts are for HP/UX or Solaris, and accept the $ORACLE_SID as an argument.
The DSS_CONFIG.KSH script will be run at 6:00 p.m. each evening to re-configure Oracle for the memory-intensive batch tasks that run each night.
dss_config.ksh

#!/bin/ksh

# First, we must set the environment . . . .
ORACLE_SID=$1
export ORACLE_SID
ORACLE_HOME=`cat /etc/oratab|grep ^$ORACLE_SID:|cut -f2 -d':'`
#ORACLE_HOME=`cat /var/opt/oracle/oratab|grep ^$ORACLE_SID:|cut -f2 -d':'`
export ORACLE_HOME
PATH=$ORACLE_HOME/bin:$PATH
export PATH

$ORACLE_HOME/bin/sqlplus -s /nologin<<!
connect system/manager as sysdba;
ALTER SYSTEM set db_cache_size=1500m;
ALTER SYSTEM set shared_pool_size=500m;
ALTER SYSTEM set pga_aggregate_target=400m;
exit
!
Now that we see a generic way to change the Oracle configuration, it should be clear that we can easily develop a mechanism to constantly monitor the processing demands on Oracle and issue the ALTER SYSTEM commands according to existing database demands.
Conclusion
While memory management within Oracle9i still largely a manual process, many Oracle administrators use writing tools that constantly monitor the RAM memory usage within the Oracle SGA, and automatically de-allocate and reallocate RAM memory based on the existing usage within the Oracle instance. This allows the Oracle administrator complete flexibility in reconfiguring their system demands on the system changed.
--
Donald K. Burleson is one of the world's top Oracle database experts. He has written 14 books, published more than 100 articles in national magazines, and serves as editor-in-chief of Oracle Internals, a leading Oracle database journal. As a leading corporate database consultant, Don has worked with numerous Fortune 500 corporations creating robust database architectures for mission-critical systems. Don's Web sites are http://www.dba-oracle.com and http://www.remote-dba.net/.
Contributors : Donald K. Burleson
Last modified 2005-06-22 12:00 AM