
Case #1: Failure to Use Bind Variables and Case #2: Network Capacity Bottleneck
These two cases are an excerpt from the bestselling book, Oracle Wait Event Tuning — High Performance with Wait Event Interface Analysis by Stephen Andert, published by Rampant TechPress. It can be purchased directly from Rampant TechPress here.
Case #1: Failure to Use Bind Variables
We want to get a feeling for the overall system, such as whether it has latch free issues or excessive waits for file reads or writes. The following scripts will give you a good idea of where your problem lies. An event with a couple hundred occurrences is probably not the cause of a problem. On the other hand, any "non-idle" wait that happened 30 million times probably merits some attention. The next steps will help you nail down the specific cause of the problem.
To tackle this problem, first, run show_system_events.sql and show_system_events2.sql. The output is shown in Figures 5.1 and 5.2 respectively.
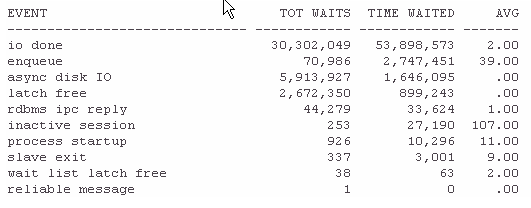
Figure 5.1: System-wide events by time waited.
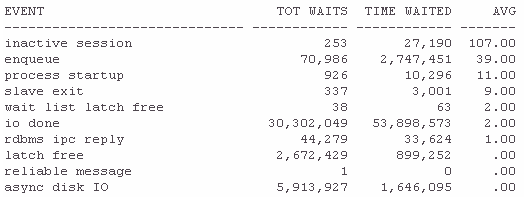
Figure 5.2: System-wide events by average time.
Notice the similarity of the events in these two figures that demonstrates either of these scripts will point you to the biggest wait events which have occurred on the system. The time waited sorted report (figure 5.1, show_system_events.sql) helps to identify the scale or magnitude of difference between these events. The average time waited sorted report (figure 5.2, show_system_events2.sql) helps identify the impact on each occurrence.
After getting a feel for the system by looking at the output from the previous scripts, we can start to narrow down our scope by running session_event_users.sql to see which users are spending the most time waiting, and what events they are waiting for.
session_event_users.sql
/* session_event_users.sql */
column USERNAME format a8
column EVENT format a30
column SID format 9999
column AVERAGE_WAIT format 99999 head "AVG|WAIT"
column TOTAL_WAITS format 99999 head "TOTAL|WAITS"
column TOTAL_TIMEOUTS format 9999 head "TOTAL|TIME|OUTS"
column TIME_WAITED format 999999 head "TIME|WAITED"
column MAX_WAIT format 99999 head "MAX|WAIT"
column TIME_WAITED_MICRO format 9999999 head "TIME|WAITED|MICRO"
set pagesize 100select
b.USERNAME,
a.*
from
V$SESSION_EVENT a,
V$SESSION b
where
a.SID = b.SID
and
b.USERNAME is not null
order by
AVERAGE_WAIT DESC;
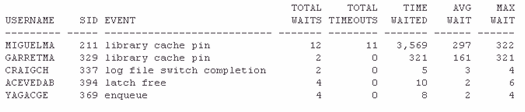
Figure 5.3: Users with top time waited.
Figure 5.3 shows that the single userid with the most time waited at this time is MIGUELMA; with close to 100 hours. That may seem absurd, but knowing this user runs batch jobs and is logged in for days at a time clears up that misunderstanding.
Also, note the top two users have both spent time waiting for the same thing; library cache pin. Remember, latch free waits appeared in Figure 5.1 with more than two million waits. One cause of “latch free” waits is the “library cache pin” so this confirms the information that we saw earlier.
Now we know WHAT is being waited on, the question is WHY? One reason this could be happening is the shared pool is improperly configured or sized. Another possible cause is failure to use bind variables.
There are also bugs that can cause this behavior. Among them is bug #2997330 which offers this suggestion: “Oracle support must be contacted if the problem persists without a visible reason.”
The next action to take in this case would be to examine the code this user is running. This can be easily done with the SID that is shown in the previous output and the show_session_sql.sql script available in the code depot.
show_session_sql.sql
/* show_session_sql.sql */
select
   SQL_TEXT
from
   V$SQLTEXT
where
   HASH_VALUE in (
      select
         SQL_HASH_VALUE
      from
         V$SESSION
      where
         SID = '&sid')
order by
   PIECE;
SQL> @show_session_sql
Enter value for sid: 211
old 12: SID = '&sid')
new 12: SID = '211')SQL_TEXT
----------------------------------------------------------------
SELECT count(*) from web_hits where status = 55
Since it appears that this query is not using bind variables, the best solution is to work with developers and change the application to use bind variables. This may involve redesigning the application to use set operations instead of individual row operations. It may involve compiler flags to allow cursor sharing. It may involve changing the location of a parse call from within a loop to before the loop so the parse call is made once; instead of once per execution. It may involve several of these. The next case study shows how to determine the current level of cursor utilization.
If this is a third party application, do not despair. The database parameter CURSOR_SHARING can be set to FORCE or SIMILAR instead of the default value of EXACT. This allows the cost-based optimizer to use the execution plan of an already parsed statement when the statement would be identical other than for the literal values. In other words, if the application were using bind variables, these statements would look the same.
The CURSOR_SHARING parameter can have a negative performance impact in some situations; such as, when an application uses stored outlines or in decision support systems (DSS), so be sure to read and test thoroughly, before implementing this parameter in a production environment.
Case #2. Network Capacity Bottleneck
When a user opens a problem report stating the database is slow, it is essential to gather V$ data as soon as possible to avoid having to tell the user that you did not find a problem, and that they should call you back if things get worse again. One way to do this is to look at the active sessions and see what they are waiting for.
The active_session_waits.sql script shows the session-level wait statistics for the sessions that are currently active. It is best to run this a number of times in a row in order to spot the recurring sessions that keep showing up.
active_session_waits.sql
/* active_session_waits.sql */

column EVENT       format a24
column STATE       format a24
column USERNAME    format a10
column SID         format 9999
column TIME        format 9999
column SEC         format 9999
column SERIAL#     format 999999
column WAIT_TIME   format 99 HEAD TIME

select
   b.SID,
   a.SERIAL#,
   a.USERNAME,
   b.EVENT,
   b.WAIT_TIME TIME,
   b.STATE,
   b.SECONDS_IN_WAIT SEC
from
   V$SESSION a,
   V$SESSION_WAIT b
where
   a.USERNAME is not null
and
   b.SID = a.SID
order by
   b.WAIT_TIME desc;
This script produces output like this sample case:
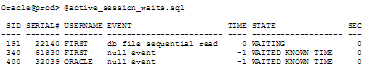
First of all, since this is Oracle version 9.2.0.3, one of the bugs mentioned earlier is showing up. The “null event” waits have no value since they cannot tell us what our bottleneck or resource constraint is. An upgrade is planned, but the user needs this performance issue resolved. Therefore, we will have to ignore the null events even though they are most likely significant.
Later, we will see how to get more information on sessions with the 10046 trace. For now though, we will focus on the “db file sequential read.” This means that this process is most likely performing an index scan.
It would be helpful to see what index is being read, so we run specific_session_waits.sql which shows us the following.
specific_session_waits.sql
/* specific_session_waits.sql */
column P1     format 999999
column P2     format 999999
column P3     format 999
column P1TEXT format a10
column P2TEXT format a8
column P3TEXT format a8

select
   SID,
   EVENT,
   P1TEXT,
   P1,
   P2TEXT,
   P2,
   P3TEXT,
   P3
from
   V$SESSION_WAIT
where
   SID in (&sid);
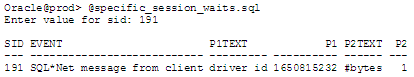
Does this mean the index being read is actually located somewhere else (SQL*Net)? No, it just means that by the time we had typed in the script name and executed it, the session reading the index had finished, and was in the process of communicating with the client session, and probably getting the next command to run. When this happens frequently, the user’s session may be bottlenecking on the network communication.
Now that we know WHAT is being waited on, the question is WHY? You can monitor the frequency of this wait event showing up in V$SESSION_WAIT and when it becomes more prevalent, consider the possibility that you are outgrowing your network bandwidth.
This can be fixed in two main ways. First, in the “throw more money at it” category, you can upgrade your network infrastructure. Switches, cable and network cards are all targets, and you will need to work with your networking group to identify where the biggest bottleneck is.
Another approach is to look at how your application is using the network and investigate ways of reducing the load. One way of reducing network traffic is to eliminate excess parsing. Every parse requires at least one round-trip between the application server, or client server if you have a two-tier configuration, and the database server. If a statement is parsed 100,000 times more than needed, there is a lot of traffic on the network that is not adding any value to the business.
In many cases, changing a compiler flag, and recompiling the application or increasing the number of cursors will help to reduce the unnecessary parses. There are a couple of things the DBA can change in the database configuration that can help reduce excessive parsing.
The script cursor_usage.sql is one way to determine whether the parse load on your database could be reduced through better cache utilization. Most of the time, this approach makes the business happier since it is a better use of resources. Also, this approach allows for a time when the hardware solution will be truly needed rather than using up that option first.
One should also try diagnosing network performance with the usual tools like ping, traceroute, nslookup, spray and netstat. Some network engineers monitor only capacity of the line, not the actual thruput. It is important to thoroughly test the line because network problems can be very difficult to diagnose and address.
cursor_usage.sql
/* cursor_usage.sql */

select
  'session_cached_cursors' parameter,
  lpad(value, 5) value,
  decode(value, 0, ' n/a', to_char(100 * used / value, '990') || '%') usage
from
  ( select
      max(s.value) used
    from
      sys.v_$statname n,
      sys.v_$sesstat s
    where
      n.name = 'session cursor cache count' and
      s.statistic# = n.statistic#
    ),
    ( select
        value
      from
        sys.v_$parameter
      where
        name = 'session_cached_cursors'
     )
    union all
    select
      'open_cursors',
      lpad(value, 5),
      to_char(100 * used / value, '990') || '%'
    from
      ( select
          max(sum(s.value)) used
        from
          sys.v_$statname n,
          sys.v_$sesstat s
        where
          n.name in ('opened cursors current', 'session cursor cache count') and
          s.statistic# = n.statistic#
        group by
          s.sid
       ),
       ( select
           value
         from
           sys.v_$parameter
         where
           name = 'open_cursors'
       );
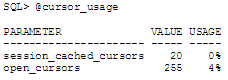
As you can see in this example, the existing 255 cursors that are available are only being used four percent of the time, so increasing that will not reduce the parsing. Since session_cached_cursors does not appear to be used, it also is set high enough.
Given that we have looked at reducing parsing, another way to reduce network traffic is to investigate the efficiency of the queries. If an application is retrieving 100,000 rows and then displaying only the ten rows with a particular value, you could eliminate 99,990 rows from the network every time that function is executed.
Standard disclaimer: As always, you should seek to imitate the offending behavior in your test system, and test the proposed corrections before trying them in a live production environment.
--
Stephen Andert is a database administrator with many years' experience and has been working with Oracle for more than five years. He has worked with various relational databases for more than12 years. He has been a technical reviewer for several Oracle books from O'Reilly & Associates, authored an article on SQL*Loader tuning, and has presented at local and international Oracle user group events. Stephen is also an Oracle8 and Oracle8i Oracle Certified Professional. His current book is Oracle Wait Event Tuning — High Performance with Wait Event Interface Analysis.
Contributors : Stephen Andert
Last modified 2005-02-10 09:27 AM