
T-SQL Debugger
What method do you use to debug your stored procedures? Do you place a number of PRINT and/or SELECT statements in your stored procedure code to help you trace down why your stored procedures do not work? Did you know that SQL Server provides a T-SQL tool for debugging your stored procedures? The tool is called the T-SQL Debugger. In this article, I will discuss how you can use the T-SQL Debugger to determine what it is your stored procedures are doing.
The T-SQL Debugger has many of the same functionalities as most debugging tools. You can set breakpoints in your code that will stop the processing of your stored procedure (SP) at a specific location in your code. You can step through your SP code one statement at a time. You can review and set the values for the local variables you have declared in your SP, as you step through your code.
The best way to show you how the T-SQL Debugger works is to run through an example that will demonstrate the functionality of the T-SQL Debugger. For my example I will use the T-SQL Debugger to review the inner workings of two stored procedures: usp_debug1, usp_debug2 and one user-defined function: udf_debug3. Yes, the Debugger can even debug user defined functions. Click here to see the code for both of these stored procedures, and the user-defined function. These stored procedures and the user-defined function do not do anything in particular, but they do allow me to show you the functionality of the T-SQL Debugger.
To start the T-SQL Debugger you can either use the object browser or object search tool. Once you have located the object you wish to debug, using one of these tools, then right click on the object. From the menu that is displayed, click on the “Debug …” option to bring up the T-SQL Debugger. Here is what is displayed when I start the Debugger for my procedure named usp_debug1:
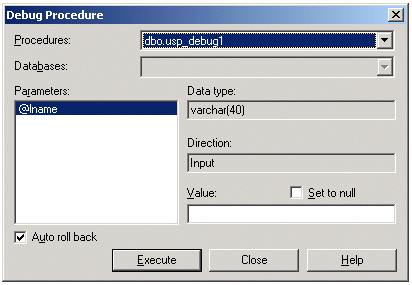
As you can see from this screen shot, I am debugging the SP named “dbo.usp_debug1.” This SP requires one parameter @lname, which is a varchar(40) variable. Prior to starting the Debugger, I need to set the value for this parameter. I can either type the value in the “value” field, or I can check the “Set to null” checkbox. Once I type in a value for my input parameter, I can click on the “Execute” button to start the Debugger. Upon clicking on this button, the following Debugger window will be displayed:
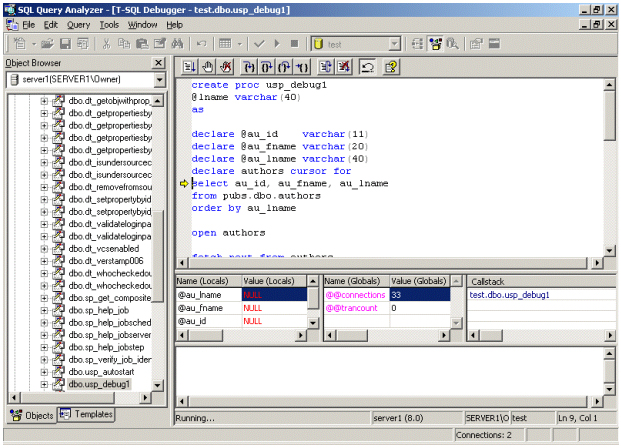
Here you can see the Object Browser window is on the left and the Debugger window is on the right. Let me close my Object Browser window, and rearrange the Debugger window so you can see all the different panes of the Debugger a little better. After doing this, my Debugger screen looks like this:
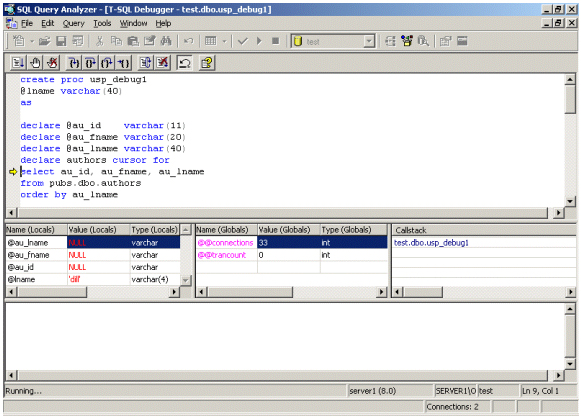
Here you can see there are 5 different panes in the Debugger, and a number of icons on the tool bar. Let me describe each one of the panes and the toolbar icons.
The top pane displays the code for the SP that is currently being debugged. The “yellow” arrow next to the “select” statement identifies the next line to be executed. In this case, it is the first executable statement in this SP, which is where this “yellow” arrow will always be when you first start the Debugger. This left middle pane will contain all the local variables defined in the SP. As you can see, the @lname variable, which is the input parameter variable, contains the value “dill” — “dill” is the value I entered on the “Debug Procedure” screen for the input parameter. The middle pane contains global variables and their values; and the right middle pane contains the “Callstack.” The “Callstack” contains a list of stored procedures or functions that are called from the original SP. The bottom pane is the results pane.
On the toolbar, you find the following icons:
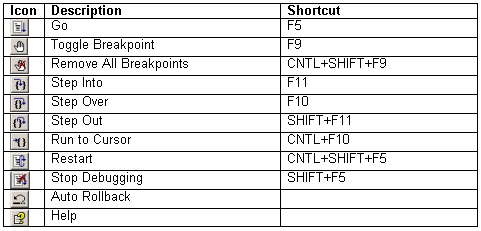
When I first start the Debugger, the Debugger is ready to run the first statement. Depending on what part of your code you need to debug, you may decide to use breakpoints, step into, or use one of the other methods to debug your code. Let’s start by showing how the “Step Into” button works.
The “Step Into” button processes one T-SQL command at time. So if I click on the “Step Into” button, the Debugger executes the “select” statement to populate the “authors” cursor, and then places the “yellow” arrow on the next line of code. The “yellow” arrow always indicates the next line of code to be executed. If I click on the “Step Into” button a second time, the “open” statement is executed and then, when I click on this button a third time, the “fetch” statement is executed. At this point, my query Analyzer screen looks like this:
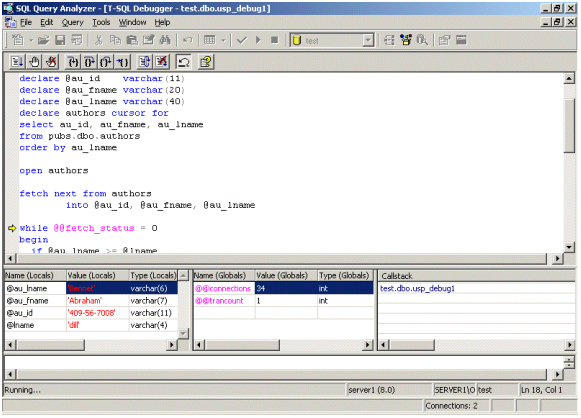
If you compare this screen shot to the prior screen shot, you will notice that the values of the first three local variables are now populated with the information from the first row of the “authors” cursor.
At any point during the debugging process you can review or change the values of these local variables. Now that I know the value for “@au_lname” on the first record of the cursor, I want to I change the value of my parameter “@lname” to “Bennet,” so my code will fall into the true condition of the “if” statement inside of my “while” loop.
To change the value of a local variable, first click on the value of the local variable in the left hand middle pane, and then type in your new value. When you are done typing, hit enter to set the local variable to the new value. After doing this, my @lname value now says “Bennet.”
Now let’s look at using the “Run to Cursor” button. This button will run the code being debugged from the current line (line pointed to by the yellow arrow) to wherever you place your cursor. This button is useful to help quickly execute a bunch of lines of code without having to execute each line of code one line at a time. So say I want to execute all the lines up to the “exec” statement a few lines down from my current position. To do this, I would use the mouse to position my cursor on the “exec” line just below the “IF … THEN” statement, and then click once. Doing this should position a flashing vertical bar on the “exec” code line. Now, I just click on the “Run to Cursor” button and the Debugger will execute all the commands up to the point where I positioned the cursor. After doing this, the “yellow” arrow is now positioned on the “exec usp_debug2” line.
Now, if you don’t need to debug the usp_debug2 SP, you can skip debugging it by clicking on the “Step Over” button. The “Step Over” button, when used in the Debugger, will execute the current command then stop on the next command. If the current command is an SP, like in my example, then the SP will be executed but I will not be allowed to debug that SP. But if you want to debug the code within the SP, then just click on the “Step Into” button. If I click on the “Step Into” button to debug my “usp_debug2” SP, then the following screen is displayed:
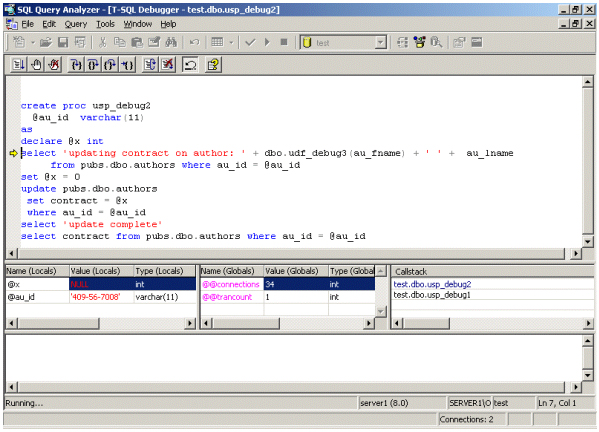
Here you can see that the Debugger is now showing the code for the “usp_debug2” SP. Note that now the “Callstack” shows that two SPs are being debugged, where the one currently being debugged is on the top of the stack.
The Debugger will also debug functions. In order to debug a function, it needs to be called from within a stored procedure. As you can see from the previous screen shot, the “select” statement will execute a function called “udf_debug3.” If I click on the “Step Into” button, I will be able to debug my user-defined function. Here is what my Debugger sessions looks like when I click on the “Step Into” button:
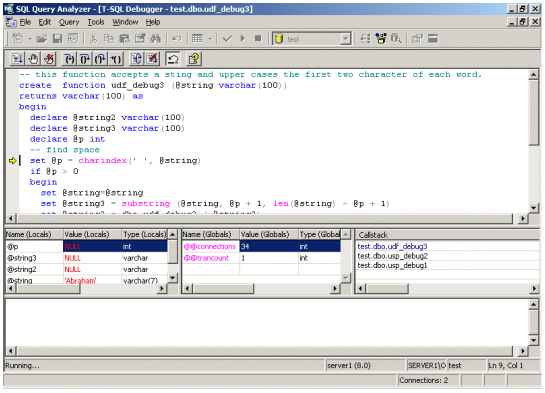
Here you can see the Debugger is displaying the code for my user-defined function “udf_debug3.” Now, I can step through the code for this function just like I could step through the stored procedure code. Note that now udf_debug3 is at the top of the “Callstack.”
Suppose now, I’m done debugging my function, and I would like to go back up to the first command following the “exec usp_debug2” statement in “usp_debug1” and continue debugging. You can do this by using the “Step Out” button. This button will complete the execution of the existing SP, or function, then stop at the line of code following the call to the current object being debugged. So since I want to go back up the “Callstack” a couple of objects, I will need to click on the “Step Out” button twice.
You may not want to debug your SP one line at a time. This is why the Debugger allows you to set breakpoints. A breakpoint is a place in your code where the Debugger will stop processing your code, so you can do some debugging. This stopping of the execution allows you to review the values for one or all of the local and/or global variables. Breakpoints allow you a convenient way to quickly jump through the execution of your code, and allow you to stop at different lines of code throughout your SP. Let me show you how to set different break points.
Suppose I wanted to set a couple of breakpoints in my usp_debug1 SP. I would first start the Debugger using the object browser. Once the Debugger was started, I would position my cursor to the line of code where I wanted to set the first breakpoint and then click on the “Toggle Breakpoint” icon. This would set a break point on that line. If I wanted a second breakpoint, I would just repeat the process of placing my cursor on the line where I wanted the breakpoint and then click on the “Toggle Breakpoint” icon. Here is a screen shot after I have set two breakpoints:
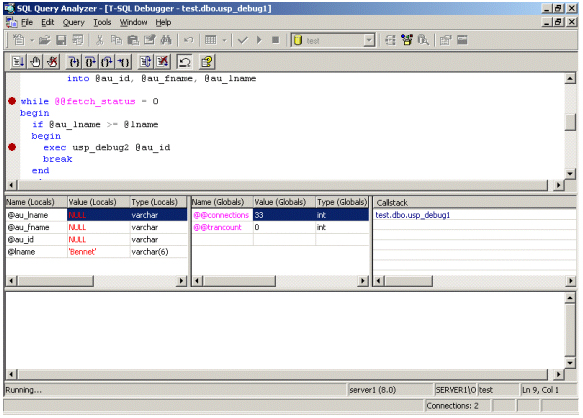
(Note that I have set a breakpoint on the “while” statement and the “exec” statement.) The breakpoints are identified by the “Red Dots” in the left hand margin of the Debugger window. Now, when I click on the “Go” icon the Debugger will run until it hits the first breakpoint. If I click on the “Go” icon a second time, then the Debugger continues processing until it reaches the next breakpoint.
Using breakpoints allows you to control where the Debugger will suspend processing, and allows you to focus in on specific parts of your code where you want to review the local and global variables. To turn off the breakpoints, click on the “Remove All Breakpoints” icon. Anytime the Debugger is stopped you can add additional breakpoints or remove all the breakpoints.
Suppose you have a SP you what to debug that updates the database. If this is the case, you may not want those updates to actually be applied permanently, especially if you need to execute your SP multiple times in order to debug it. For debugging an SP that updates your database, the Debugger has the “Auto Rollback” button. This button toggles on and off with each click. The default is to have the button depressed, which means “Auto Rollback” is enabled. When this button is depressed, any updates made during the debugging session will be rolled back. If you desire to have your updates be applied to the database, then you can toggle this button off by clicking on it.
The last two buttons are fairly self-explanatory, they are “Restart” and “Stop Debugging.” The “Restart” button when clicked on will restart your Debugger session from the top. If you have manually overridden any input parameters to your SP, then the parameters will be reset to the value you first specified when starting the Debugger. When clicked on, The “Stop Debugging” icon will stop your debugging session. It will not close the Debugger window, rather it only stops the execution of the SP you are currently debugging.
If, during your debugging session, you need to change the code of the SP you are debugging, then the code changes will not be reflected in your current debugging session. You will need to close your debugging session, and then start a new debugging session from the object browser to get your new changes into your debugging session.
You will not be able to have more than one Debugger session running at that time. This is because SQL Server will only allow you to have a single Debugger session open at a time. When you try to start a second Debugger session you will get the following prompt:
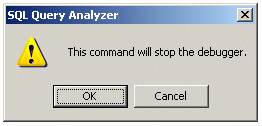
This prompt allows you to either keep the current session going, by clicking on the “Cancel” button, or stop the existing debugging session and starting a new session by clicking on the “OK” prompt.
There are a few known problems with the T-SQL Debugger. These problems are documented on the following Microsoft page, along with some troubleshooting tips:
http://support.microsoft.com/default.aspx?scid=kb;en-us;280101
Conclusion
As you can see, the T-SQL Debugger provides an easy method of debugging your SP. You can set breakpoints, step through your code one statement at a time, and you can even review and change local variables on the fly. Using the T-SQL Debugger beats putting a bunch of PRINT statements into your code to determine what your SP is doing. Next time you need to debug one of your SPs, you might consider trying the T-SQL Debugger.
--
Gregory A. Larsen is a DBA at Washington State Department of Health. He has been working with computers since the late 1970s, and has a BS in Computer Science, with a minor area of study in Mathematics. During Greg’s DBA career, he has managed databases on Windows, Unix, and IBM mainframes; before becoming a DBA, he developed and maintained applications. Greg has written a number of articles for different Web publishing sites, as well as SQL Server Magazine. Greg also maintains a Website that contains a number of SQL Server examples to common DBA and SQL developer issues.
Contributors : Gregory A. Larsen
Last modified 2005-04-12 06:21 AM